Dashboards
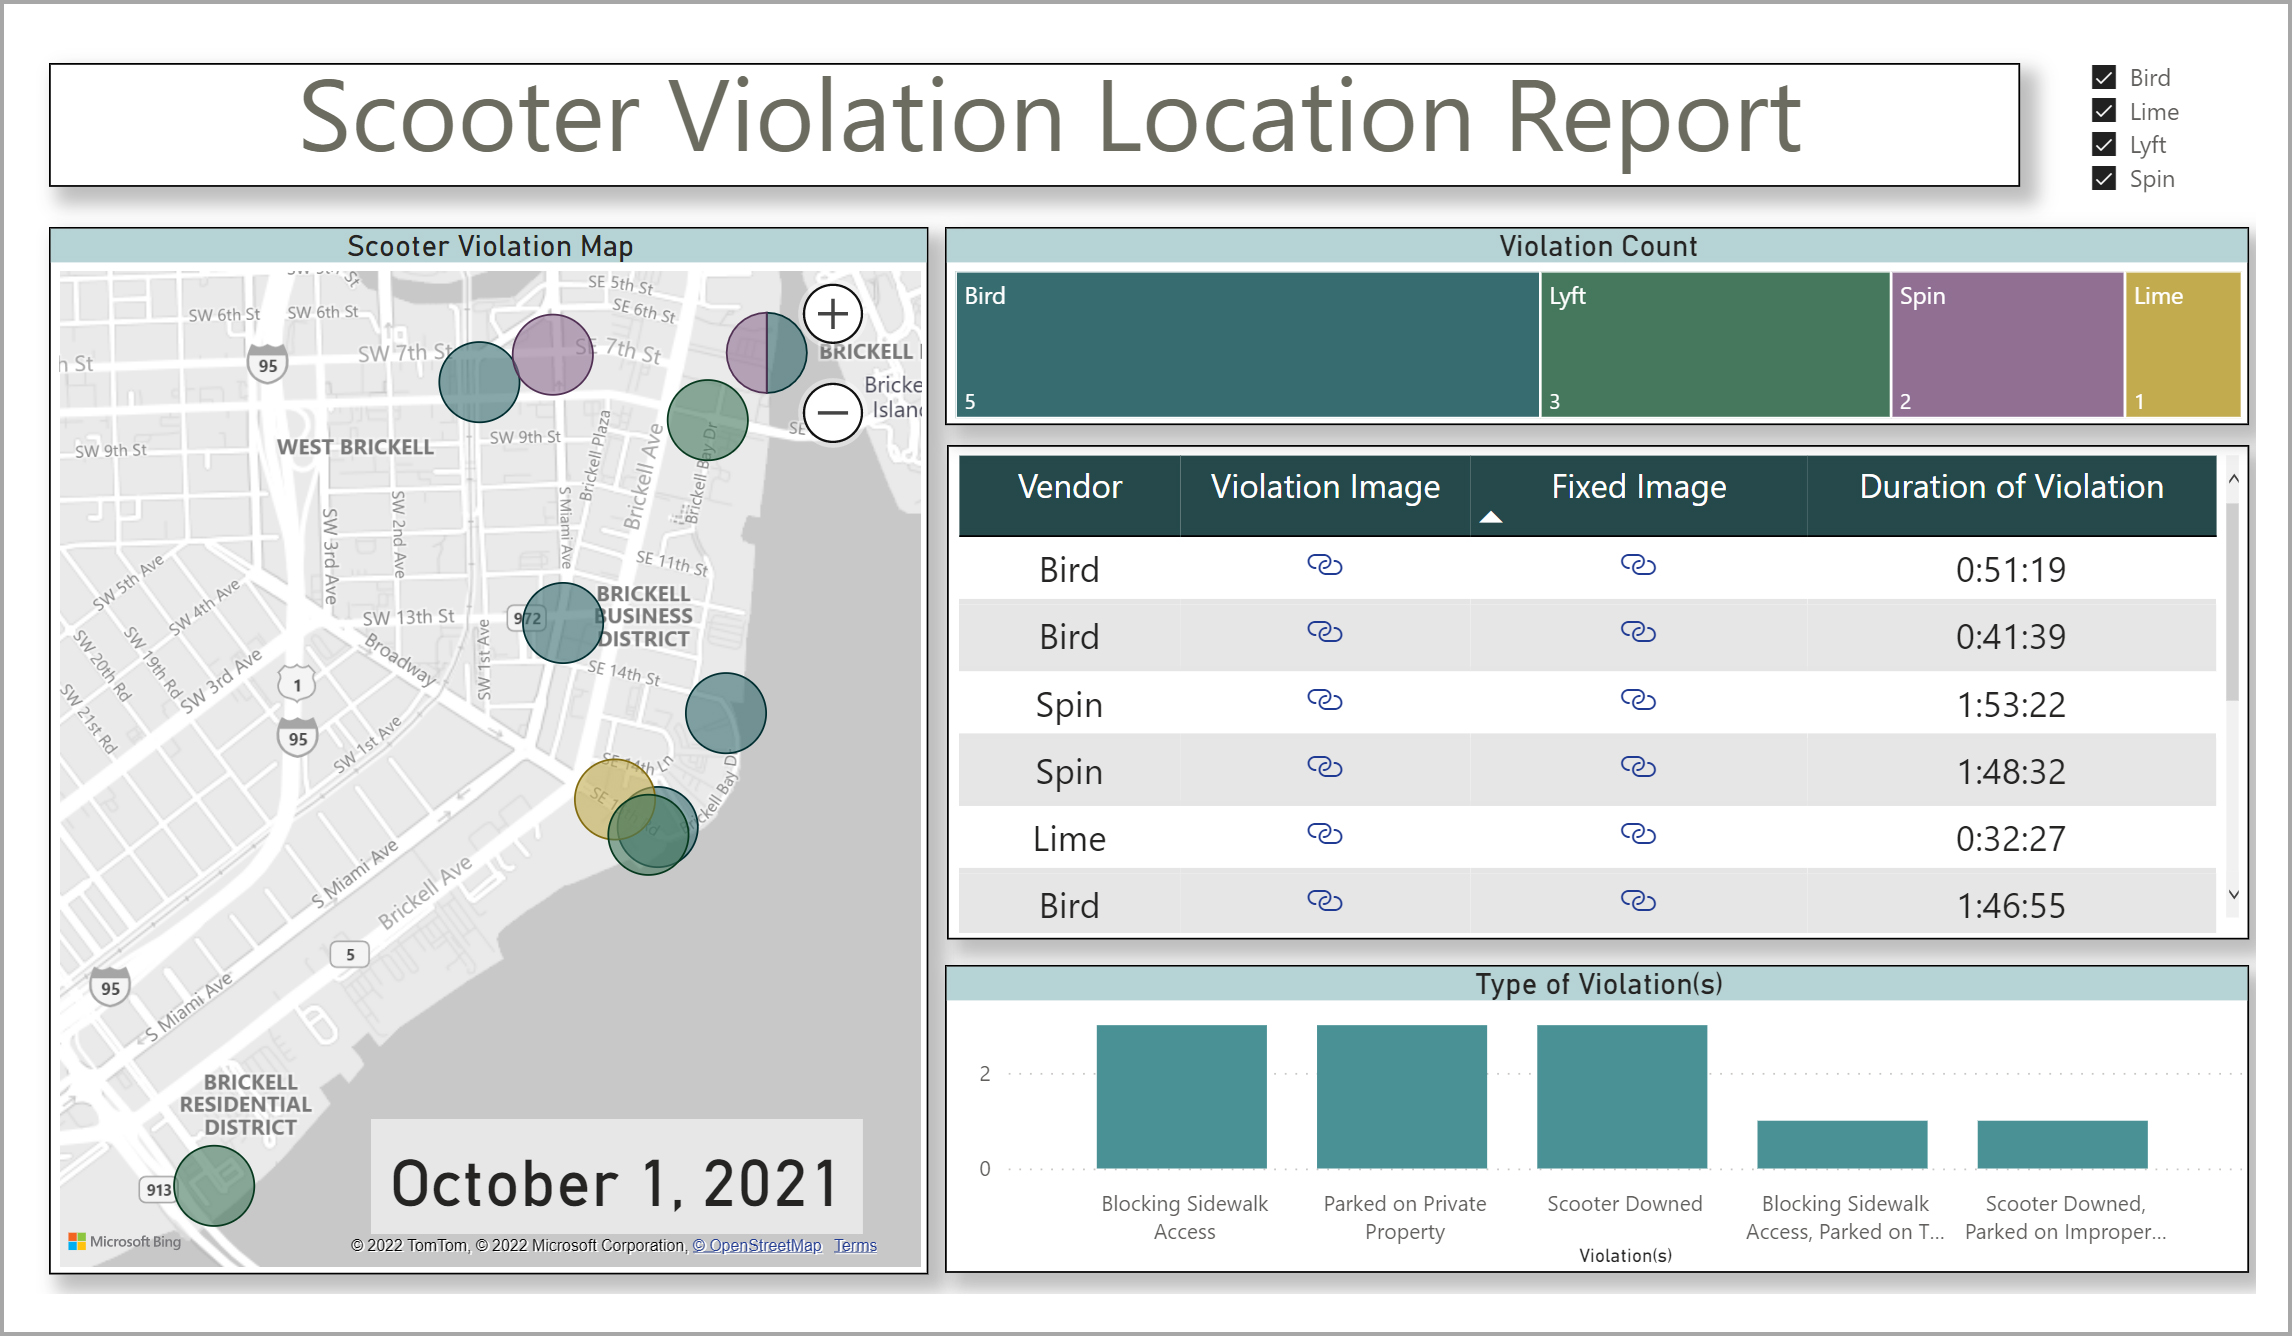
This is a Scooter Mobility Violation Report Miami Scooter open source data to track specific violation locations and information associated with time durations of violations. I used latitude and longitude codes to create a map visual with each violation location. It contains violation count per vendor, report with Vendor Name, Violation Image Link, Fixed Image Link and Duration Times of violations as the fields. Image links can be clicked to populate images in a separate browser. As violations are being analyzed, “Type of Violation” chart displays what the violation was reported as and the “Violation Date” visual shows the date of the violation. Dashboard is dynamic and can be populated for all vendors, multiple selected vendors, or single vendors. When a single vendor is being looked at, the title will appear with the Vendor’s Name in it. All charts and visualizations adjust as you interact with any part of the dashboard.
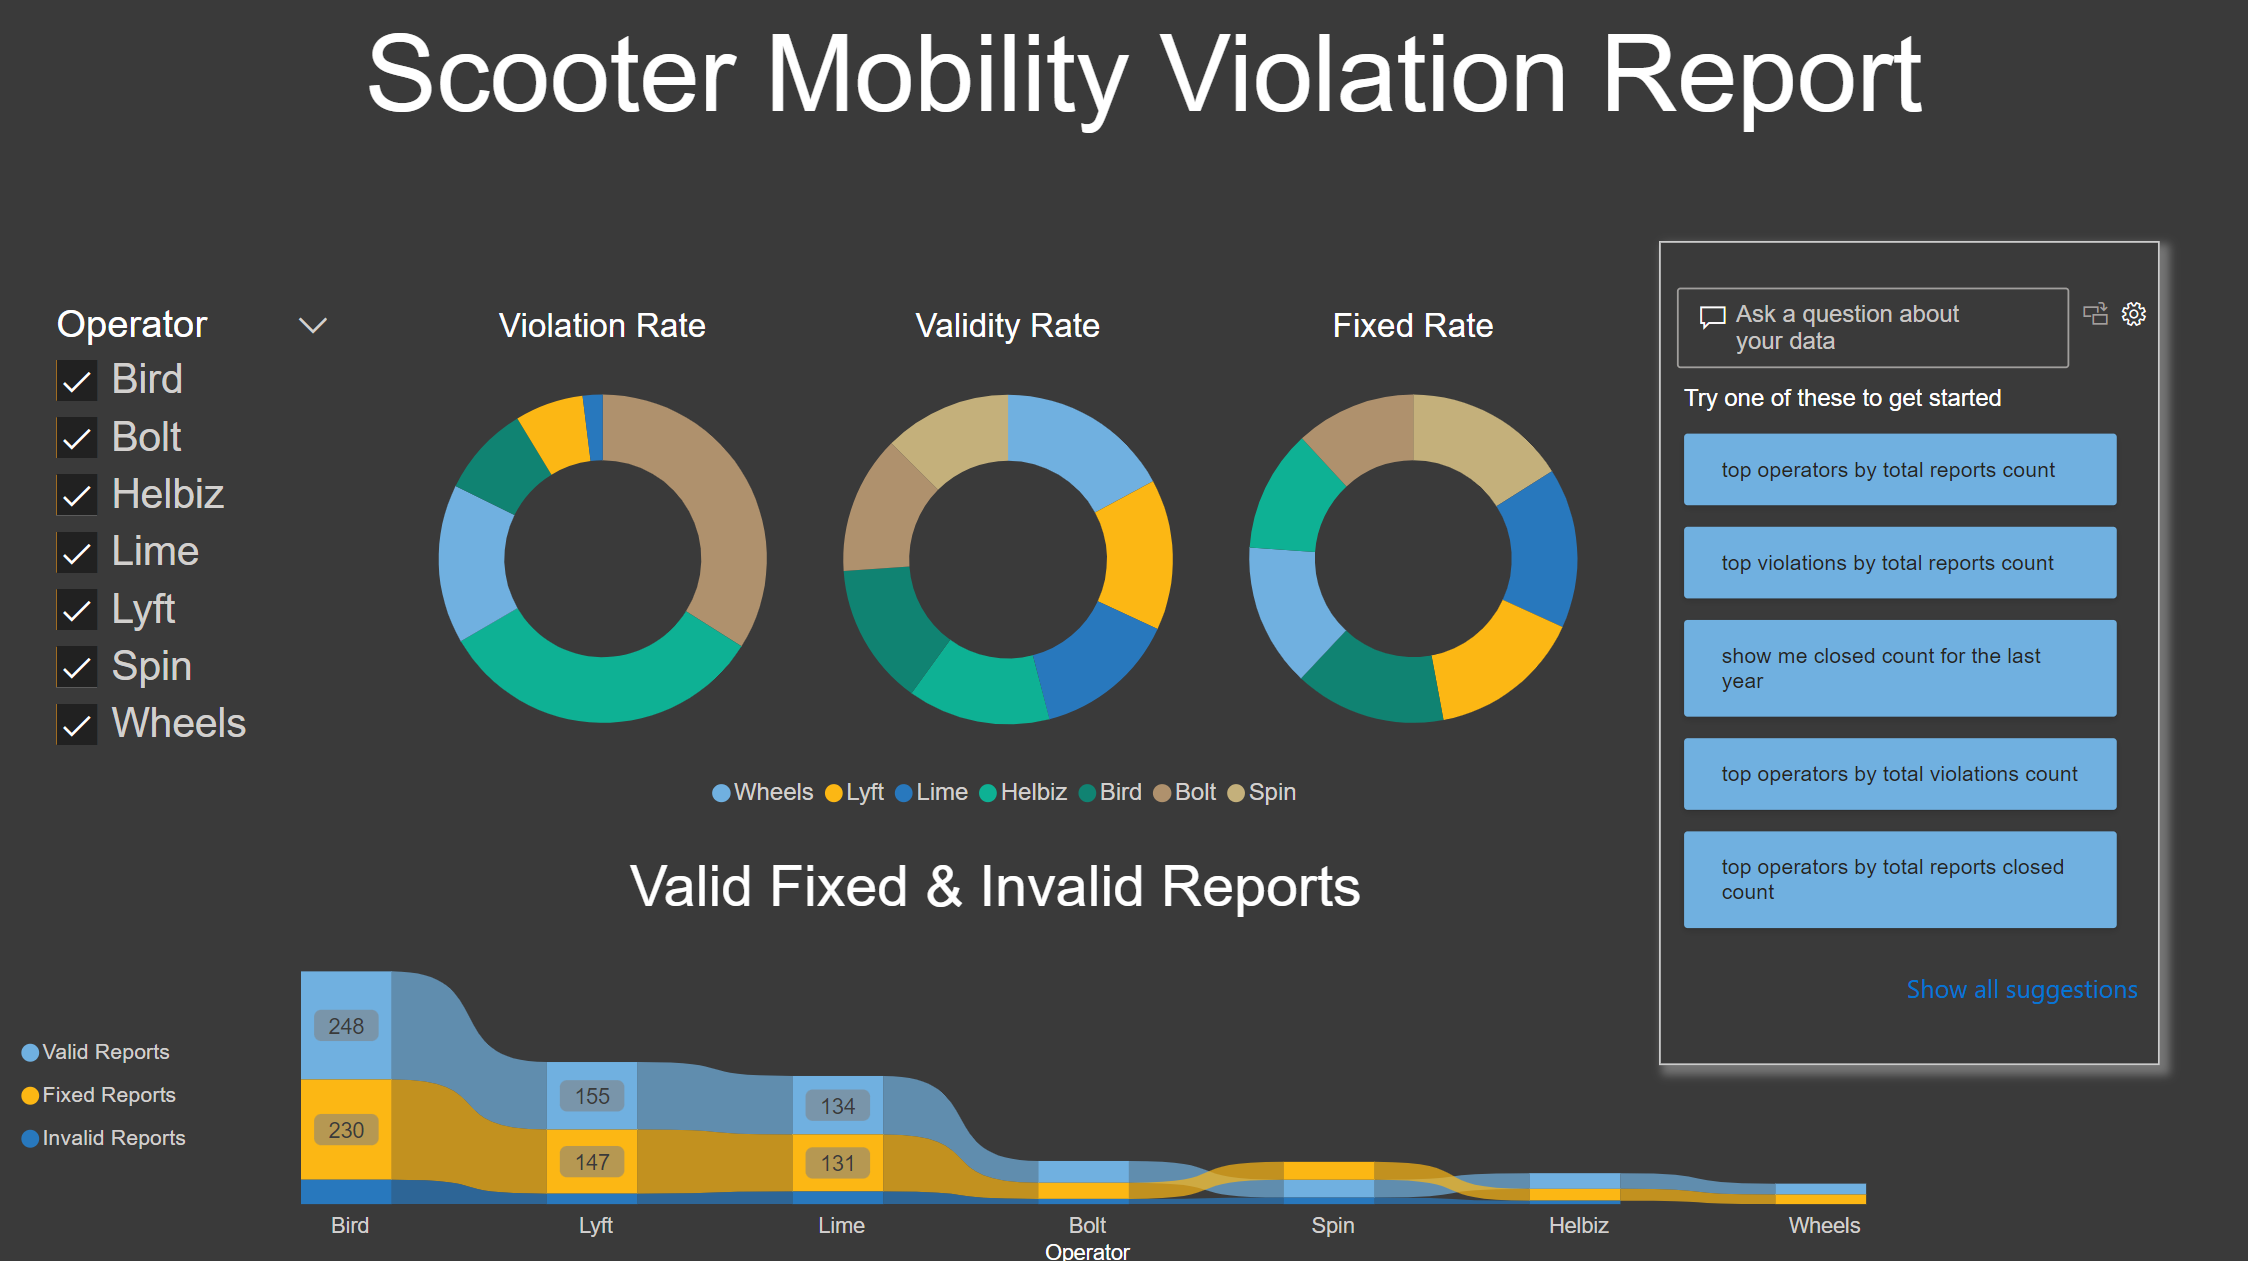
This is a Scooter Mobility Violation Report using Miami Scooter open source data designed to break down rates associated with the violations of Miami scooter transportation companies. It displays violation rate, validity rate, and fixed rate between vendors using donut chart visuals. At the bottom, another visual shows the actual counts of valid reports, invalid reports and fixed reports and on the right there is a Q&A visual that populates any specific requests regarding the data in the report.

This is a Scooter Pick Up Report using Impound scooter data that lays out a breakdown of impound payments and average impounds for each company. The top visual allows you to filter through multiple companies by selecting the names. The Total Payment Amount bar chart shows the total amount each company has spent on impounds to date. The report also shows a Yearly and Monthly Payment Breakdown that dissects payments by year and month, monthly breakdown, and monthly quantity of impounds. The Average Impound Per Company tree map visual displays the average amount of impounds per company.

This is a Scooter Mobility Violation Report using Miami Scooter open source data to digest information for various company violations. It displays Count of Violations that can be drilled through by Quarter, Month and Day by clicking on the values. Fixed Rate by Operator chart shows the total percentage of fixed and closed violations per Operator. You can click any name of Operator either at the slicer at the top or throughout and of the charts and it will produce the data for that specific Operator. You can also select any combination of Operators.
